Un exemple basic pour se familiariser avec RMarkdown
Commençons par le commencement
Quelques opérations classiques
x <- c(1,2,3,5)
print(x)

## [1] 1 2 3 5

y <- x-1
print(y)

## [1] 0 1 2 4
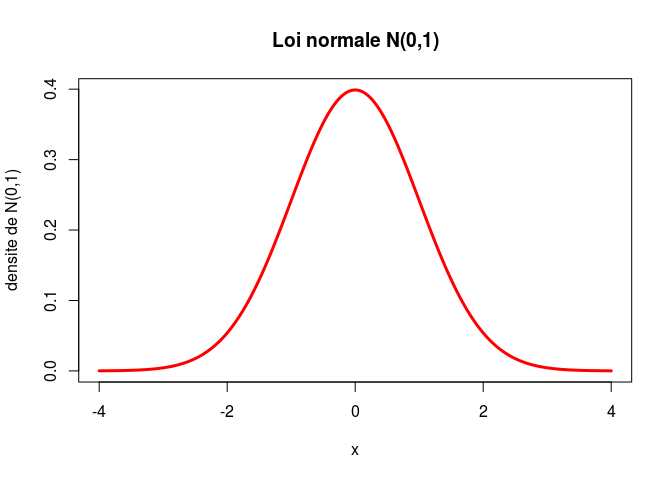
Un peu de graphes ??
r1 <- seq(from=-4, to=4, by=0.01)
r2 <- dnorm(r1)
plot(r1,r2,type="l",col="red",main="Loi normale N(0,1)",xlab="x",ylab="densite de N(0,1)",lwd=3)
Une petite pause
Sortez le pop-corn et tapez cela en ligne de commande
telnet towel.blinkenlights.nl